Large transformations typically involve implementing new procedures, policies, tools, systems, ways of working and behaviour or cultural change. So, how will you know if people are using the new tools and systems or following the new ways of working?
How to Measure Change Adoption
Measuring change adoption determines whether people have moved from awareness and training to actually using the new processes, technology and behaviours as intended to realise the desired business outcomes. Some of these will be demonstrated quickly in the short term, others will be realised longer term.
A useful approach is to use change metrics which measure:
Usage – are people actually using the new system, tools, process or capability? For example: active users by department/business unit, frequency of use, repeat usage, legacy usage, feature utiilisation, transactions completed in the new system
Engagement – are people actively participating and embracing the change? For example: training attendance, workshop participation, intranet page visits, change champion activity, survey response rates, feedback submitted, number of improvement suggestions
Compliance – are people following the new ways of working correctly and consistently? For example: % following the new process, % completing activities correctly, use of approved systems, number of process deviations, number of workarounds
Business Outcomes – are the desired outcomes being realised? For example: impact on productivity, efficiency, quality, cost, revenue, customer satisfaction, employee experience, compliance and risk
Defining the appropriate adoption KPIs within performance dashboards provides feedback, measurement and good insight into where adoption is weak or strong and why people may not have adopted the change. It also provides evidence of whether the adoption is being translated into measurable business value.
How do dashboards provide visibility across programmes
Dashboards provide visibility by enabling leaders to answer the following questions quickly:
Where are we?
Where are we off track?
What is causing this to happen?
What action do we need to take?
Are benefits being realised?
An effective dashboard provides visibility across programmes by turning multiple sources of change, adoption, delivery, and benefit data into a single view that helps leaders understand what is happening, where risks exist, and where action is needed.
Dashboards are effective as they:
Create a single source of truth across all programmes –
instead of each project /programme reporting differently, it can standardise the measures being used across programmes to view:
The overall programme status
Delivery progress
Change readiness
Adoption status
Risks and issues
Dependencies
Resource capacity and constraints
Enable drill down from portfolio level to project level –
A good dashboard should operate at different levels to allow leaders to break problems down further and establish the cause of any issues.
Provide different stakeholders different views –
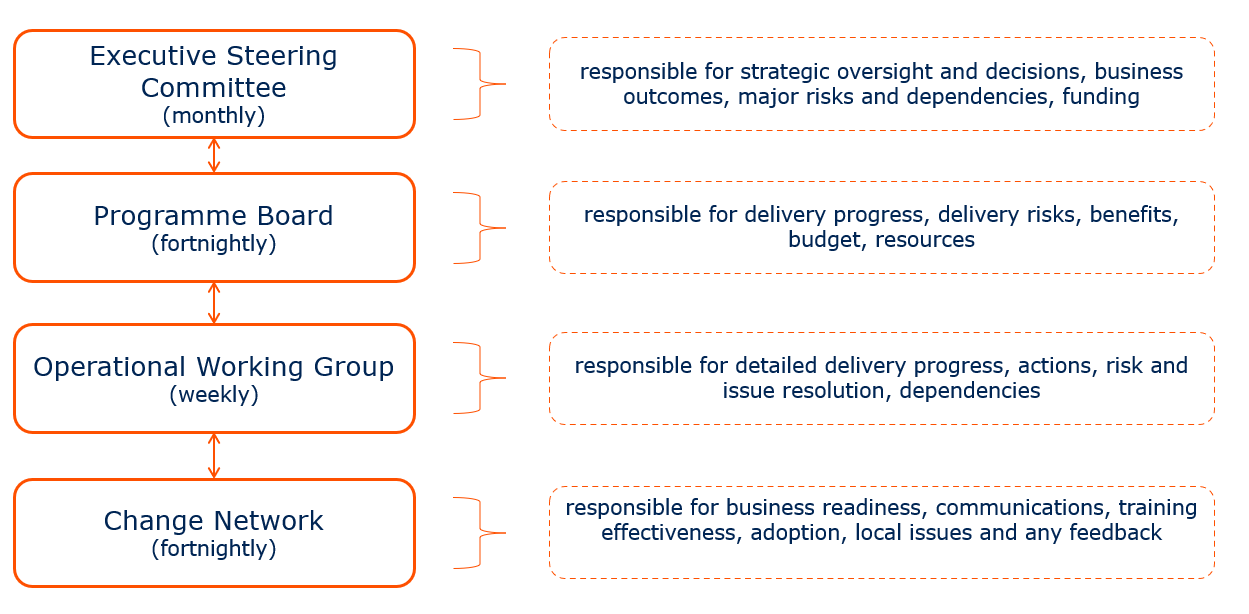
Dashboards can use the same underlying data to present the relevant information for different stakeholders. While the Executive Committee may focus on overall programme health, major risks to delivery and benefits, the operational business managers may focus on their team’s readiness, training, usage and performance.
Enable identification of cross-programme trends –
Dashboards can reveal patterns or trends which may not be visible when managing programmes separately. For example low adoption within specific departments or business units across several programmes may not reflect the programme delivery but could be due to insufficient leadership capacity, operational constraints or insufficient training.
Turn data into Management action –
The most effective dashboards will not just be used as a reporting tool, but will be used as a management tool to identify actionable insights.
Examples of effective reporting and governance
Effective reporting and governance in change management should provide clear visibility, accountability and decision-making rather than just producing reports.
A good governance structure may consist of:
An executive steering committee report should be short, visual and decision focused. At the working group level, reports should include:
cross programme status reporting outlining milestones and dependencies,
a RAID (Risk, Assumptions, Issues and Dependencies) log,
a decision log
a training log
a change adoption log and
a benefits tracker
Dashboards provide visibility by transforming complex programme data into actionable insights. They allow leaders to monitor adoption, engagement, compliance, benefits, and risks in one place. When combined with effective reporting and a good governance structure this enables faster decision-making, targeted interventions, and improved realisation of change outcomes across the entire portfolio of programmes.
Do you need Change Management expertise?
At Project One, our team of experienced change and programme management professionals brings hands-on expertise to drive complex transformation programmes. We combine leadership, governance, and delivery capability to help customers achieve sustainable business performance improvements faster and with greater certainty. If you are embarking on or already delivering a transformation programme and would like some guidance or just a sounding board, please get in touch via theteam@projectone.com.

 How drama free is your change programme? take our free programme health check
 Our change and transformation Podcast Listen to our latest Podcast